Build Your Own Bluesky Analytics Dashboard
Are you using Bluesky and want to stay on top of what’s happening? Are you curious how you can use Shaper to pull data from APIs and build interactive dashboards, all in a single tool and using just SQL?
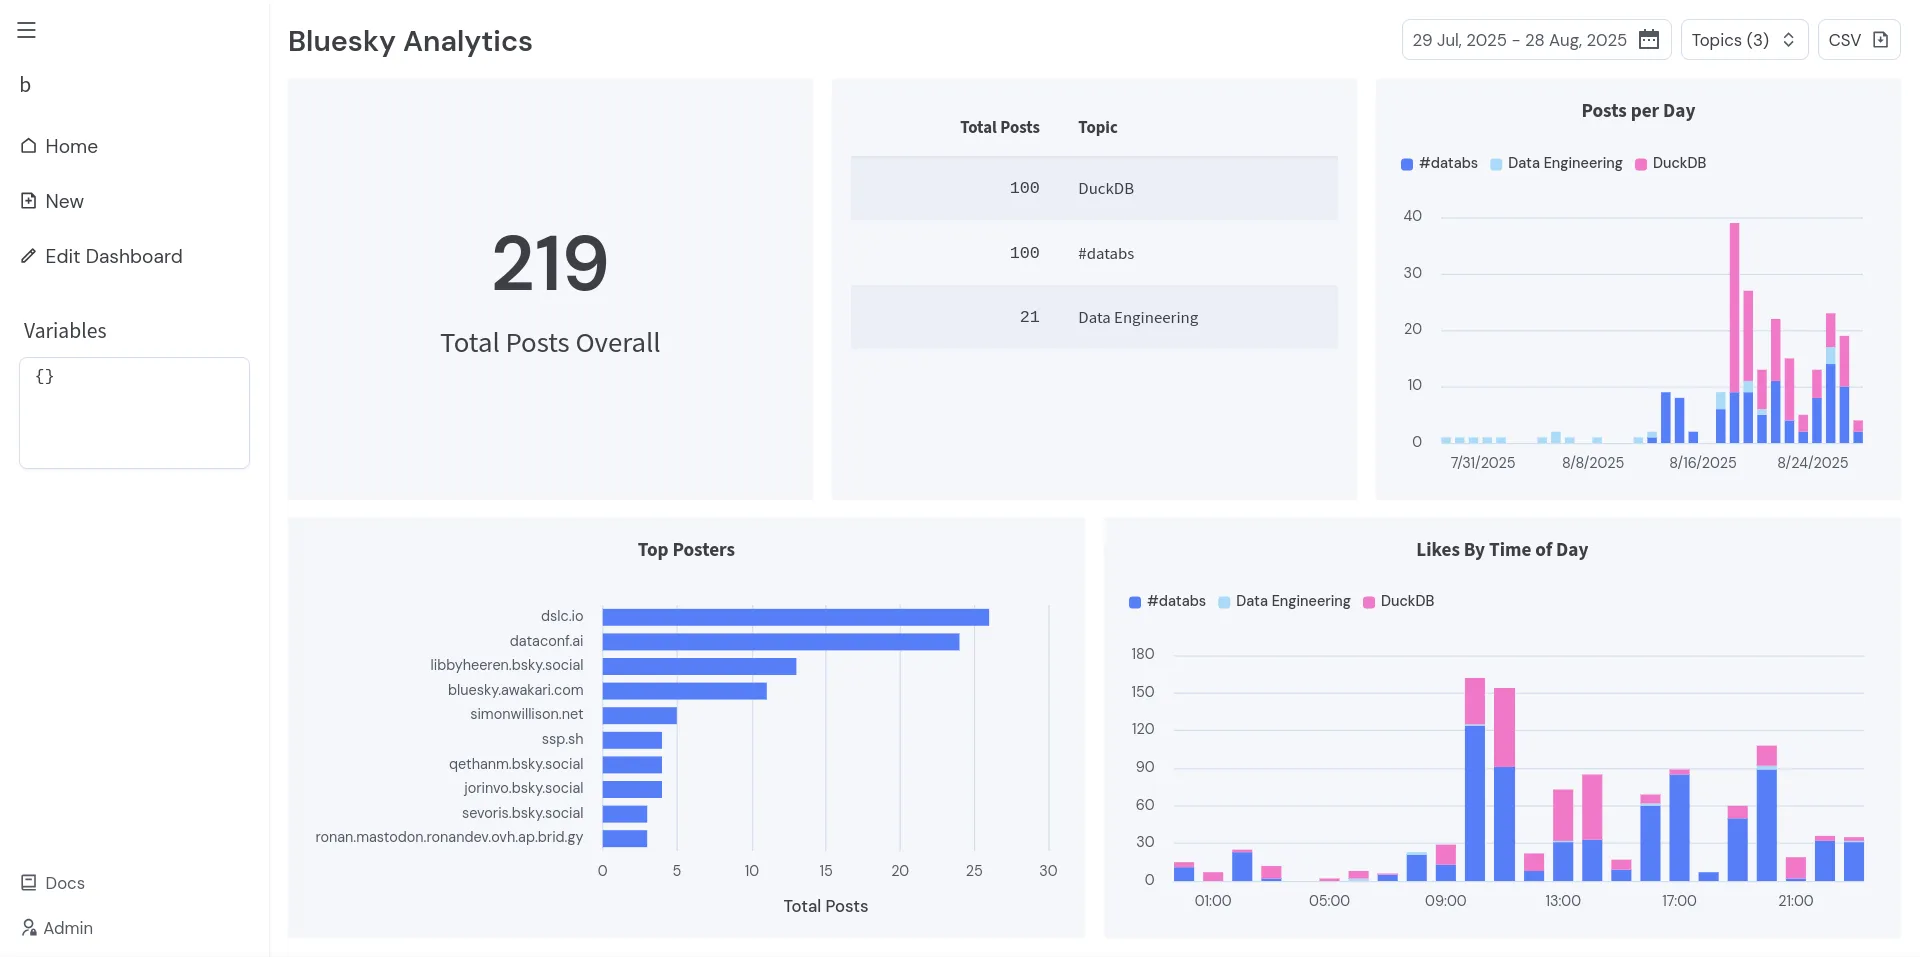
Let’s automate pulling posts data from the Bluesky API to track topics we are interested in, and then create a data dashboard that visualizes activity around these topics.
You will get a dashboard that looks like this:
Let’s Get Started
Section titled “Let’s Get Started”- Let’s open a terminal, create a new directory, and change into it:
Terminal window mkdir bluesky-dashboard && cd bluesky-dashboard - You will need credentials to authenticate with the Bluesky API.
Create a Bluesky App Password and save it together with your handle asbluesky_credentials.json:
Terminal window echo '{ "identifier": "", "password": "" }' > bluesky_credentials.json - Now let’s run Shaper. The easiest way is to run it via Docker or NPM:
Terminal window docker run --rm -it -p5454:5454 -v ./bluesky_credentials.json:/bluesky_credentials.json -v ./data:/data taleshape/shaperTerminal window npx @taleshape/shaper -d ./data - Open http://localhost:5454 in your browser and click on New.
Now let’s create a Task to fetch posts from Bluesky and store them in a database table. Select Task in the dropdown at the top of the page and paste in the following SQL code:
The task is configured to run every hour and fetch new posts for the topics “DuckDB”, “Data Engineering”, and “#databs”.SELECT (date_trunc('hour', now()) + INTERVAL '1h')::SCHEDULE;INSTALL http_client FROM community;LOAD http_client;CREATE SCHEMA IF NOT EXISTS bsky;CREATE TABLE IF NOT EXISTS bsky.posts (topic VARCHAR,created_at TIMESTAMP,cid VARCHAR,author_handle VARCHAR,url VARCHAR,text VARCHAR,like_count INT,reply_count INT,quote_count INT,repost_count INT,loaded_at TIMESTAMP DEFAULT now(),);SET VARIABLE access_jwt = http_post('https://bsky.social/xrpc/com.atproto.server.createSession',headers => MAP {'Content-Type': 'application/json','Accept': 'application/json',},body => (SELECT c FROM './bluesky_credentials.json' c)) ->> 'body' ->> 'accessJwt';WITH topics AS (SELECT col0 AS topic, col1 AS query_string FROM (VALUES('DuckDB', 'duckdb'),('Data Engineering', '"data-engineering" "data engineering" "dataengineering"'),('#databs', '#databs'),)),topics_with_ts AS (SELECTtopic,query_string,coalesce(max(loaded_at), (now() - INTERVAL '30 days')::TIMESTAMP) as last_loaded_at,FROM topics LEFT JOIN bsky.posts USING(topic)GROUP BY ALL),json_posts AS (SELECTtopic,(http_get('https://bsky.social/xrpc/app.bsky.feed.searchPosts',headers => MAP {'Accept': 'application/json','Authorization': concat('Bearer ', getvariable('access_jwt')),},params => MAP {'q': query_string,'limit': '100','since': strftime(last_loaded_at, '%Y-%m-%dT%H:%M:%SZ'),}) ->> 'body' -> '$.posts[*]').unnest() AS pFROM topics_with_ts)INSERT INTO bsky.posts BY NAME (SELECTtopic,(p ->> '$.record.createdAt')::TIMESTAMP AS created_at,p ->> 'cid' AS cid,p ->> '$.author.handle' AS author_handle,concat('https://bsky.app/profile/', author_handle, '/post/', split_part(p ->> 'uri', '/', -1)) AS url,p ->> '$.record.text' AS text,(p -> 'likeCount')::INT AS like_count,(p -> 'replyCount')::INT AS reply_count,(p -> 'quoteCount')::INT AS quote_count,(p -> 'repostCount')::INT AS repost_count,FROM json_posts);
Replace the topics with your own topics.
Then click Run to try out the task. If the task runs successfully, click Create and save it asFetch Bluesky Posts. - With the first data loaded, we can now create a dashboard to visualize the data.
Click on New again and paste in the following SQL code:
Now click Create and save the dashboard asSELECT 'Bluesky Analytics'::SECTION;SELECTmin(created_at)::DATE::DATEPICKER_FROM AS start_date,max(created_at)::DATE::DATEPICKER_TO AS end_date,FROM bsky.posts;SELECT 'Topics'::LABEL;SELECT distinct topic::DROPDOWN_MULTI AS topics FROM bsky.posts;CREATE TEMP VIEW posts AS (FROM bsky.postsWHERE topic in getvariable('topics')AND created_at BETWEEN getvariable('start_date')AND getvariable('end_date'));SELECT concat('bluesky_posts_', today())::DOWNLOAD_CSV AS CSV;SELECT * FROM posts;SELECT count(distinct cid) AS 'Total Posts Overall' FROM posts;SELECTcount() AS 'Total Posts',topic AS Topic,FROM posts GROUP BY topic ORDER BY ALL DESC;SELECT 'Posts per Day'::LABEL;SELECTtopic::CATEGORY,date_trunc('day', created_at)::XAXIS,count()::BARCHART_STACKED,FROM posts GROUP BY ALL ORDER BY ALL;SELECT ''::SECTION;SELECT 'Top Posters'::LABEL;FROM (SELECTcount(distinct cid)::BARCHART AS "Total Posts",author_handle::YAXIS,FROM posts GROUP BY ALL ORDER BY ALL DESC LIMIT 10) ORDER BY ALL;SELECT 'Likes By Time of Day'::LABEL;SELECTtopic::CATEGORY,date_trunc('hour', created_at)::TIME::XAXIS,sum(like_count)::BARCHART_STACKED,FROM posts GROUP BY ALL ORDER BY ALL;Bluesky Analytics. - Click on View Dashboard in the top right corner to have a better look at the whole dashboard.
And you are done! Please reach out, ask questions and I would love to see what you built.
Shaper is open source and free to use. It’s simple to run on your own server and so you can easily share dashboards with others. Find out more on Github: