
Analytics
built into
your product
Customer-facing dashboards, PDF reports, and data exports — all SQL, all in your infrastructure.
Explore Documentation >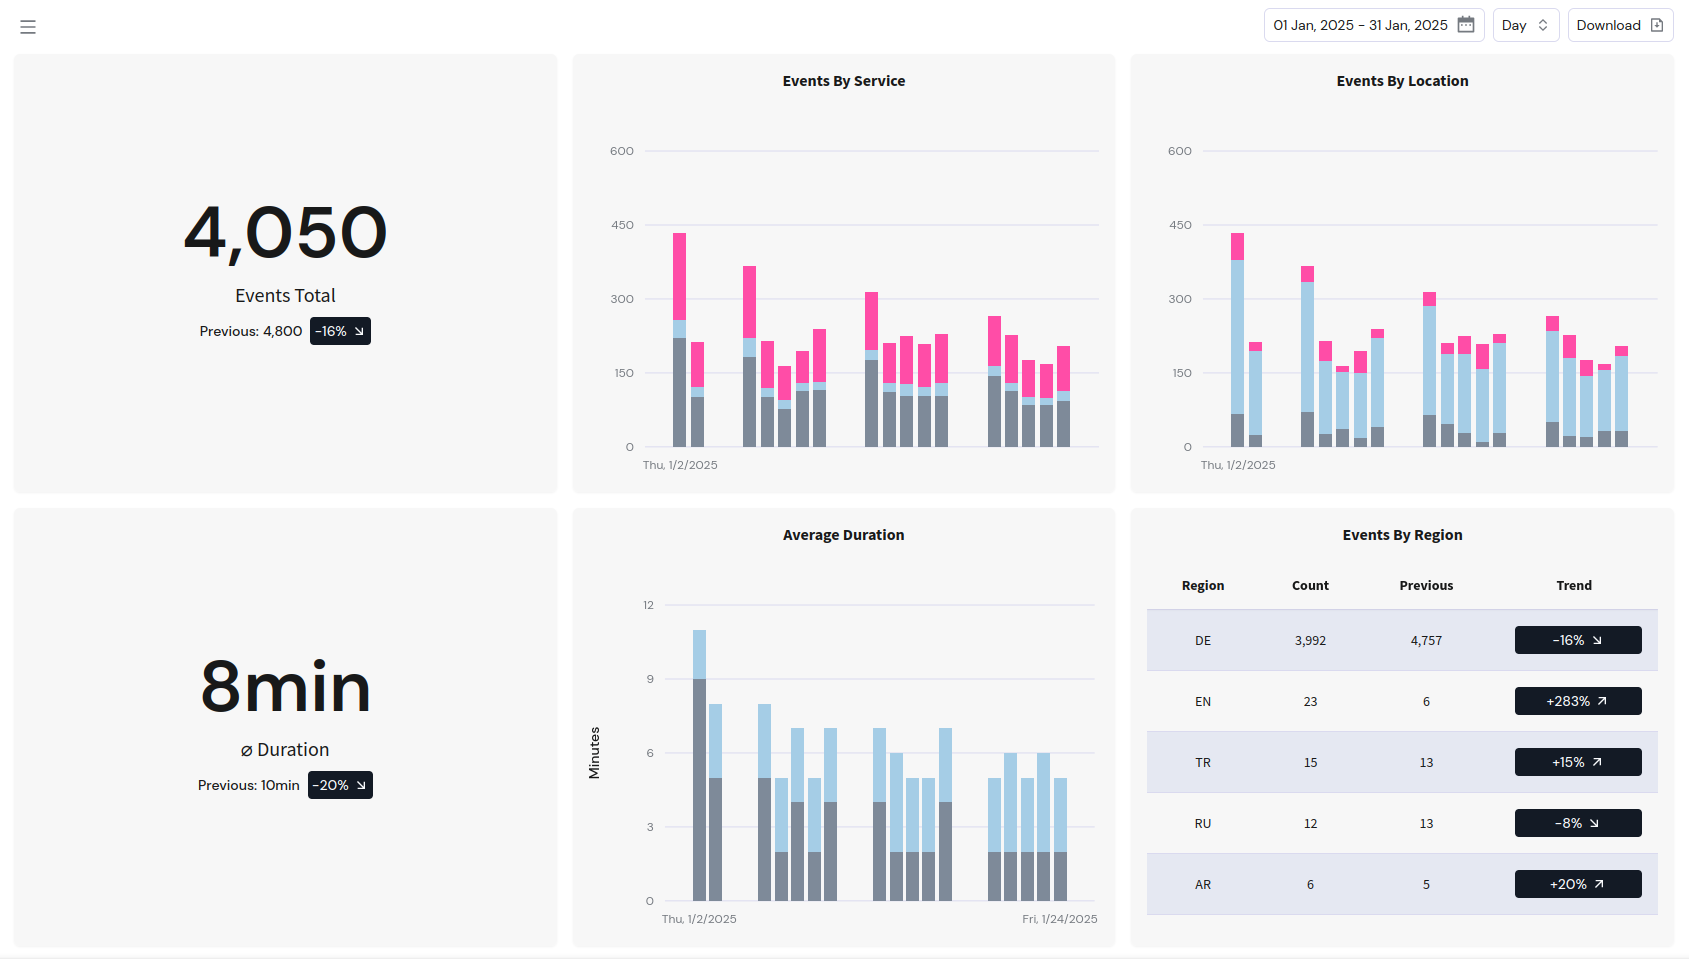
Ship analytics features faster
Customer-facing dashboards, PDF reports, Excel exports — everything is SQL. Build in hours what would take months from scratch.
Use AI without exposing sensitive data
Generate and iterate on dashboards with any AI agent. Because everything is SQL code, AI builds analytics without ever seeing your underlying data.
Stay audit-ready
Every dashboard, report, and data export is SQL code versioned in Git. Full change history for compliance and security reviews.
What customers are saying
"Since working with Taleshape we are able to quickly visualize and share data with customers. We also keep finding new use cases, from Embedded Analytics to PDF creation and internal research tools."

"Our Engineering and Operations team relies on Taleshape to quickly access relevant, actionable data with the power of DuckDB to create embeddable reports and dashboards in minutes."

"Taleshape enabled us to add embedded analytics to our product with no extra tooling, while keeping full control over our data and avoiding vendor lock-in."

How it works
A toolkit, not a BI platform
Embed dashboards directly in your React app without iframes. Generate PDFs and Excel files on the fly. Customize everything with CSS. This isn't another centralized BI tool — it's a flexible data visualization layer that becomes part of your product.
Your product
Dashboards embedded directly
No iframes. No redirects. Full CSS control.
Everything is just SQL
No YAML, no proprietary query language. Write SQL files your team already knows, version control them with Git, and deploy with your existing CI/CD. Use any AI agent to generate and iterate on dashboards.
-- revenue.dashboard.sqlSELECT'Monthly Revenue'::LABEL;SELECTdate_trunc('month', order_date)::XAXIS,sum(total_amount)::BARCHART,FROM's3://bucket/orders.parquet'GROUP BY ALL ORDER BY ALL;
Runs anywhere, fully open source
Single Docker container. Powered by DuckDB with connections to Postgres, S3, Google Sheets, and more. Fully open source — inspect the code, self-host, fork it. Your data never leaves your network.
Open source — inspect, self-host, fork
Single Docker container
DuckDB + Postgres + S3 + more

Your fractional data team
We act as your fractional data team — helping you build a secure, auditable analytics foundation without the overhead of a full-time hire. We don't just hand you a tool. We help you set it up, integrate it into your product, and keep it running. We continuously monitor for security findings and proactively deliver fixes to keep your infrastructure safe.
Why teams choose Taleshape
| Build In-House | Legacy BI Tools | Taleshape | |
|---|---|---|---|
| Time to Ship | Months of engineering | Weeks of integration | Days — write SQL, embed, ship |
| Data Sovereignty | Full control (you built it) | Multi-tenant SaaS cloud | 100% in your infrastructure |
| Auditability | Only if you build it | Opaque UI-driven changes | Git-versioned SQL — full change history |
| AI Integration | Custom implementation needed | Requires sending data to AI vendors | AI generates SQL code, never sees your data |
| Security & Compliance | Your team's responsibility | Manual patching, black-box updates | Proactive monitoring & security fixes |
| Ongoing Maintenance | Permanent eng headcount | Vendor-dependent, per-seat costs | Open source — we handle operations |
From the Blog
Stay Updated
Get the latest articles and news delivered to your inbox.
Ready to add analytics to your product? Let's talk about what you need.