The agent itself is a simple Python application that listens to Slack messages.
When it receives a message, it uses an LLM to answer the user request.
We give the LLM tools to use Shaper’s API to generate png/pdf/xlsx files directly from SQL queries.
We then upload the generated files to Slack. While the LLM generates the SQL, it doesn’t touch the results, avoiding the risk of hallucinated data or charts.
Since we control the agent and Shaper runs in our own infrastructure, we are also in full control of what data the LLM sees and which LLM we use.
This setup can be easily adapted to fit the privacy and security needs of any organization.
Building your own agent not only means that you stay in full control of your data, but also that you can build an agent that is truly useful in practice.
You can narrow the problem scope and build an agent for exactly the workflows most useful to you, integrating it into your processes with the context it needs.
Shaper provides the foundation to access data, create charts and reports, while ensuring correctness and keeping everything reproducible.
At Taleshape, we help our customers build systems exactly like this agent.
If you’d like to learn more, don’t hesitate to reach out.
Subscribe to Newsletter
Get the new post delivered straight to your inbox.
Do you need to store and analyze large amounts of data without breaking the bank?
Do you need to run in your own infrastructure instead of relying on the big cloud providers?
You can build a simple data lake platform that scales from a $5 VM to petabytes of data with these three open source tools: DuckDB, DuckLake, and Shaper.
When you have only a small amount of data you can use DuckDB to directly query your production database such as Postgres, but as your data grows that gets slow and expensive.
One alternative is to replicate data to a data warehouse such as Snowflake, BigQuery, Redshift or even Clickhouse. But warehouses are complex to operate and expensive.
Building a data lake architecture means storing data as files in a cheap object storage such as S3.
Data is then stored in a format optimized for analytics such as Parquet files.
And DuckDB can query those files really efficiently - fast enough for most use cases even with large amounts of data.
But Parquet files are read-only. To update data you need to create a new file.
So you quickly end up with a large number of files that you need to manage and the need to rewrite files for better performance.
That’s why a data lake needs a metadata layer - a catalog of all the data.
Once you have a catalog, using a data lake feels just like using a database:
You create, update and insert into tables without thinking about Parquet files.
The catalog automatically rewrites and optimizes the files for you as needed.
If your infrastructure provider already supports Iceberg on top of its object storage and you don’t mind paying the premium for that, that’s a great option for a data lake.
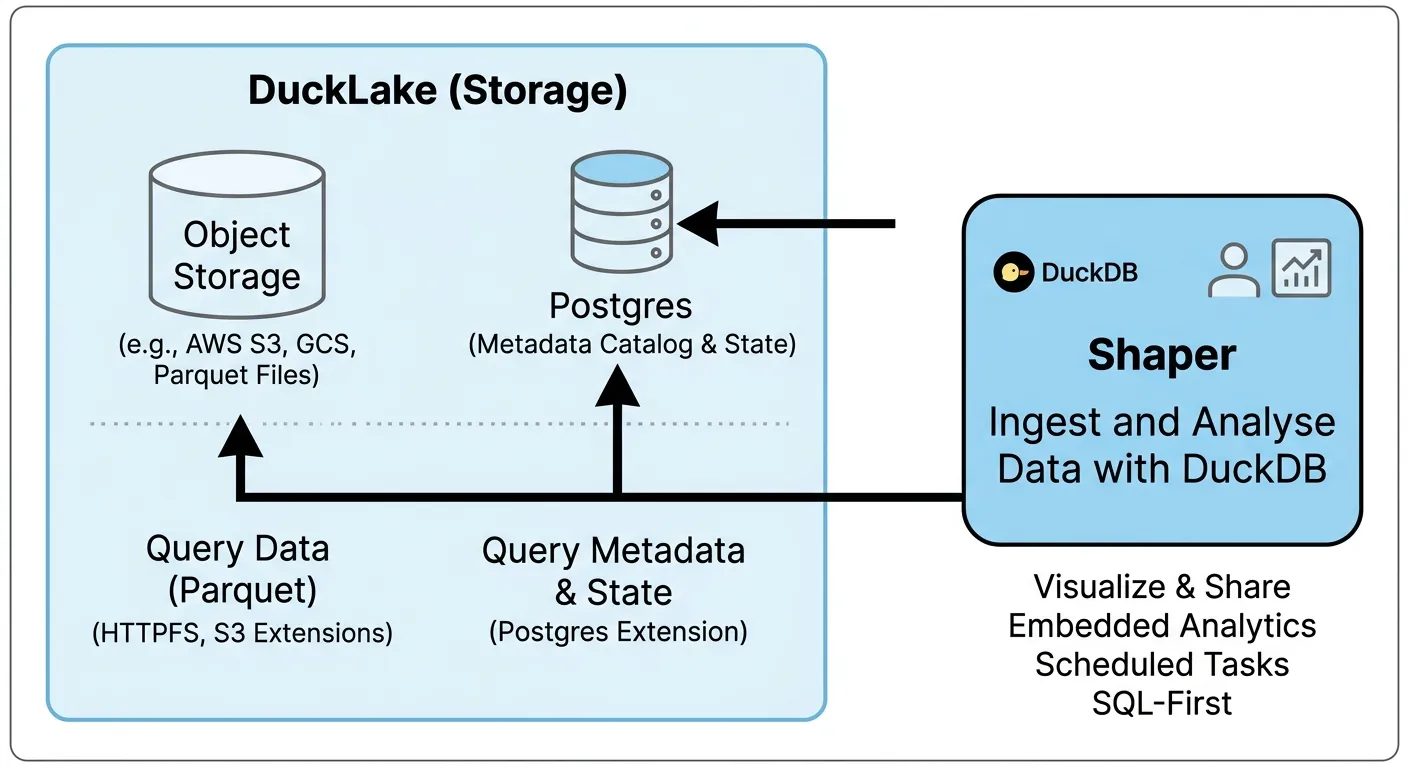
However, to run your own data lake on top of any object storage, DuckLake is much simpler than running your own Iceberg implementation.
DuckLake doesn’t require any additional services to run. It works with any object storage and supports many databases for its catalog.
If you have an S3-compatible service and a Postgres database, you can start using DuckLake without any new infrastructure.
Click on “Create” at the top right and give the task a name such as “Ingest Sessions Data”.
Now click on “Run” in the top right corner.
Congrats, you’ve loaded your first data into DuckLake!
For real use cases you would want to schedule tasks to run automatically and then you would use for example MERGE INTO to update your data lake continuously.
And of course not only Shaper can access DuckLake. For more complex setups you can introduce other tools for your data pipelines such as DBT and Dagster.
If you are looking for a more affordable hosting provider or prefer a European provider over the big American cloud providers, I recommend you look into Hetzner (referral to get free 20€).
You get a VM for 3.49€ and 1TB of object storage for 4.99€, hosted in Germany.
Just be careful that there are some gotchas with Hetzner’s object storage. To make sure your setup is properly secured, check out this detailed guide by my friend Floyd:
Usually you will run Shaper on a server. Then you only need shaper dev locally when developing dashboards.
Once you configured authentication for your Shaper instance, the dev command will automatically prompt you to login and authenticate.
And instead of running deploy manually, you can use the Shaper Github Action to deploy dashboards automatically in your CI/CD pipeline.
Nowadays, every company is a data company. From marketing and sales to product usage and customer support, all aspects of your business generate data.
And that data is waiting to be activated. Turn it into reports to drive decisions. Build dashboards to support operations. Offer new product features and services to your customers that are directly driven by data and automation.
Getting started is much more a cultural challenge than a technical one.
Start small. Make sure you see first successes by doing the work manually without worrying about big investments in making it scalable.
But once you see concrete value and it becomes painfully clear that technology is holding you back, you know it’s time to build out your data capabilities.
Where do you go from here? Can you buy an off-the-shelf solution? Do you hire a data engineer? Do you need a dedicated data team or can your existing engineers handle it?
You can break down data infrastructure into four main layers:
Ingestion: Connect data sources, extract data and load it into a central repository
Storage: Store data in a structured format that is optimized for analytical workloads
Transformation: Clean, enrich, and transform data to make it practical to work with and ensure consistent definitions of key metrics across the organization
Analytics: Create dashboards, reports, and alerts to share insights internally and with your customers and partners
Start with querying your data directly where it is. Introduce tools to load data into a central repository only when the complexity and volume make this impractical.
You don’t need to address all data sources at once. Focus on the ones creating problems. Accept manual workarounds when practical.
Your data tooling should be able to query data across different data sources. You don’t need to worry about ingestion if directly querying a Postgres database and a Google Sheet gets the job done.
Chances are you already store your data in a database such as PostgreSQL or MySQL. If you’re not having performance issues, there’s no need to introduce a separate database for analytical workloads.
Only if performance or cost becomes an issue should you start addressing it.
Storage is a critical component since it’s where the actual data lives. Data outlives applications built on top of it. Pick an established and open standard to store data.
Keep in mind that there is no one-size-fits-all solution. You might need multiple data stores optimized for different use cases. You’ll know what you’re looking for when you act on concrete problems instead of trying to find a solution for hypothetical future problems.
Start delivering value before adding a separate data transformation step. Introduce a dedicated data transformation layer when queries start taking too long, or metrics become unreliable and hard to maintain because the same logic is repeated in many places.
A few materialized views in your database can take you a long way.
You’ll know it’s time to look into real-time stream processing, data lineage and orchestration tools once you experience the issues that these tools are designed to solve.
Many software companies start out by building custom analytics features. As you use data to drive operations and user-facing functionality, building custom solutions for every new workflow and view on the data becomes slow and expensive.
Introduce a data visualization tool to quickly build analytics dashboards and reports. This is a great first step and enables a single data analyst to deliver a lot of value without introducing any other data infrastructure.
Are you using Bluesky and want to stay on top of what’s happening?
Are you curious how you can use Shaper to pull data from APIs and build interactive dashboards, all in a single tool and using just SQL?
Let’s automate pulling posts data from the Bluesky API to track topics we are interested in,
and then create a data dashboard that visualizes activity around these topics.
Let’s open a terminal, create a new directory, and change into it:
Terminal window
mkdirbluesky-dashboard && cdbluesky-dashboard
You will need credentials to authenticate with the Bluesky API.
Create a Bluesky App Password and save it together with your handle as bluesky_credentials.json:
--init-sql"INSTALL http_client FROM community; LOAD http_client;"
Terminal window
npx@taleshape/shaper-d./data
Open http://localhost:5454 in your browser and click on New.
Now let’s create a Task to fetch posts from Bluesky and store them in a database table.
Select Task in the dropdown at the top of the page and paste in the following SQL code:
The task is configured to run every hour and fetch new posts for the topics “DuckDB”, “Data Engineering”, and “#databs”.
Replace the topics with your own topics.
Then click Run to try out the task. If the task runs successfully, click Create and save it as Fetch Bluesky Posts.
With the first data loaded, we can now create a dashboard to visualize the data.
Click on New again and paste in the following SQL code:
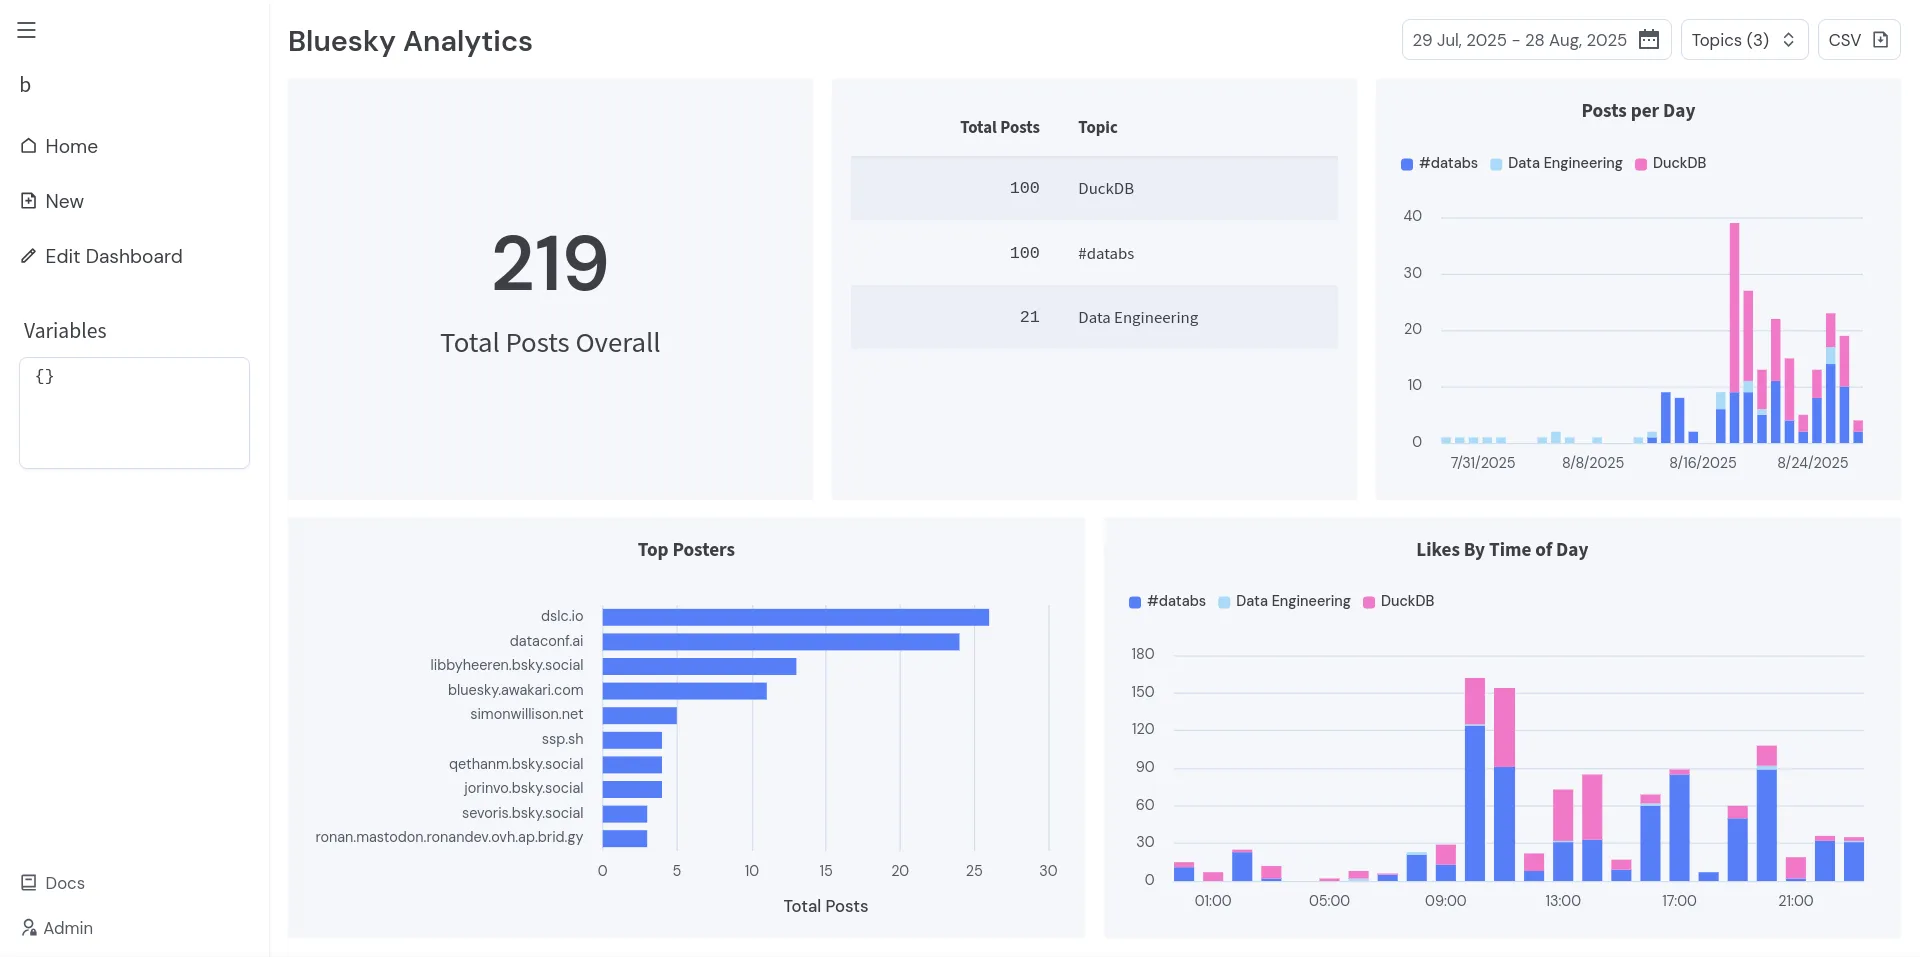
Now click Create and save the dashboard as Bluesky Analytics.
Click on View Dashboard in the top right corner to have a better look at the whole dashboard.
And you are done!
Please reach out, ask questions and I would love to see what you built.
Shaper is open source and free to use. It’s simple to run on your own server and so you can easily share dashboards with others. Find out more on Github: