Getting Started
Build your first dashboard and get familiar with Shaper’s SQL approach.
Shaper is built on top of DuckDB and uses SQL not only to query and transform data, but also to build interactive dashboards on top of it.
Alternative: Checkout the new file-based workflow instead of using the online editor.
Quick Start
Section titled “Quick Start”- Make sure Shaper is installed and running. Then open http://localhost:5454.
- Click on “New” to create your first dashboard.
- Copy and paste the following SQL code into the editor:
SELECT 'Shaper Sessions Demo Dashboard'::SECTION;CREATE TEMP TABLE sessions AS (FROM 'https://taleshape.com/sample-data/sessions.csv');SELECTmin(created_at)::DATE::DATEPICKER_FROM AS start_date,max(created_at)::DATE::DATEPICKER_TO AS end_date,FROM sessions;SELECT 'Category'::LABEL;SELECT category::DROPDOWN_MULTI AS categoryFROM sessions GROUP BY category ORDER BY category;CREATE TEMP TABLE dataset AS (SELECT * FROM sessionsWHERE category IN getvariable('category')AND created_at BETWEEN getvariable('start_date')AND getvariable('end_date'));SELECT ('sessions-' || today())::DOWNLOAD_CSV AS "CSV";SELECT * FROM dataset;SELECT count(*) AS "Total Sessions" FROM dataset;SELECT 'Summary'::LABEL;SELECTcategory AS "Category",count(*) AS "Sessions",to_seconds(round(avg(duration))) AS "Avg Duration",FROM dataset GROUP BY "Category" ORDER BY "Sessions" DESC;SELECT 'Sessions By Time of Day'::LABEL;SELECTdate_trunc('hour', created_at)::TIME::XAXIS AS "Time of Day",count(*)::BARCHART AS "Total Sessions",FROM dataset GROUP BY ALL ORDER BY ALL;SELECT ''::SECTION;SELECT 'Sessions per Week'::LABEL;SELECTdate_trunc('week', created_at)::XAXIS,category::CATEGORY,count(*)::BARCHART_STACKED,FROM dataset GROUP BY ALL ORDER BY ALL;SELECT 'Average Session Duration per Week'::LABEL;SELECTdate_trunc('week', created_at)::XAXIS,category::CATEGORY,to_seconds(round(avg(duration)))::LINECHART,FROM dataset GROUP BY ALL ORDER BY ALL;
- Now click “Create” (top-right) and give the dashboard a name.
- You should see a dashboard similar to this:
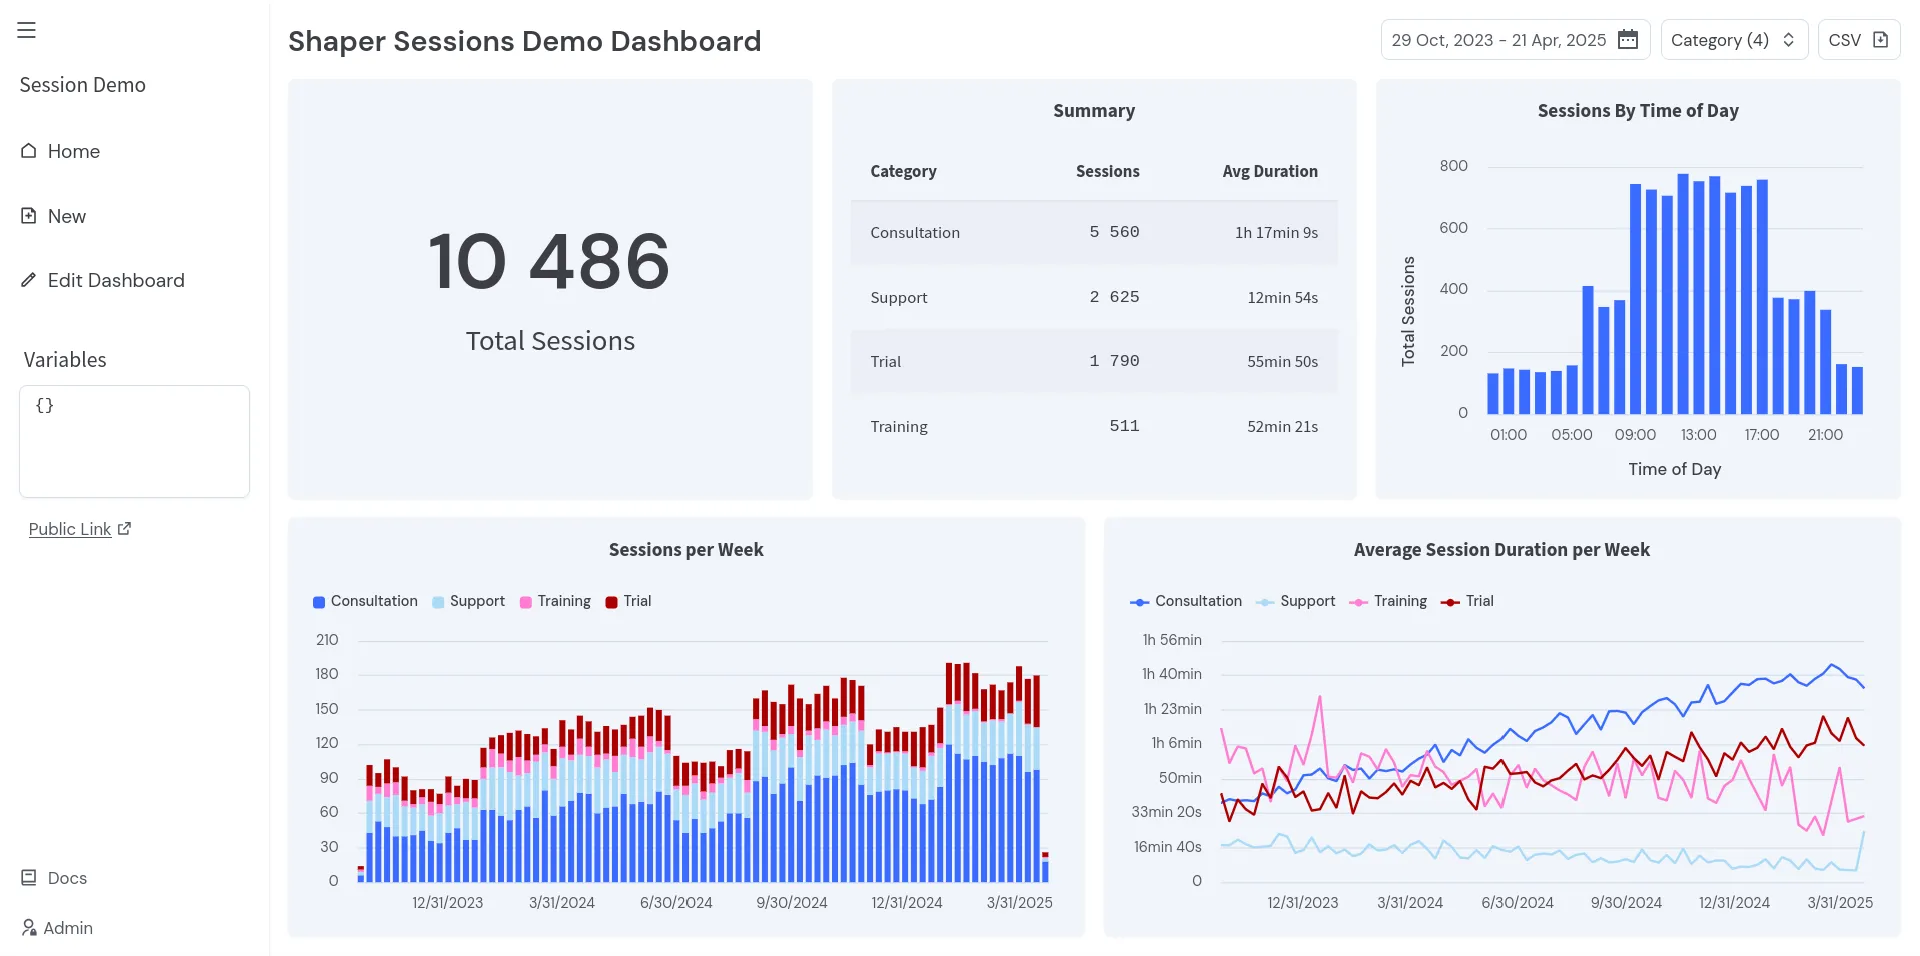
Congrats! You are done!
Next, let’s go through the code step by step to understand how it works.
Step by Step
Section titled “Step by Step”All the SQL queries above are simply DuckDB SQL.
If you are new to DuckDB, you can learn more about all its SQL features, data types, functions and more with its comprehensive documentation:
Connecting to Your Data Sources
Section titled “Connecting to Your Data Sources”In the example above, we query data via HTTP from a CSV file:
CREATE TEMP TABLE sessions AS ( FROM 'https://taleshape.com/sample-data/sessions.csv');We then cache the data in a temporary table to avoid downloading the same data multiple times.
DuckDB supports different formats and data sources out of the box.
Shaper supports any DuckDB extension, so you can attach to any existing database such as Postgres, configure secrets to query data from your data lake and so on.
SQL for configuring your setup is not part of the dashboard, but handled separately. To learn more see:
Building Dashboards using SQL
Section titled “Building Dashboards using SQL”Shaper renders each SQL query as UI component.
We define custom data types such as BARCHART or DROPDOWN to specify how data should be rendered.
You can see the full list of available data types here:
Defining Variables
Section titled “Defining Variables”Let’s take a look at the first SQL query.
The first SELECT renders a date range picker:
SELECT min(created_at)::DATE::DATEPICKER_FROM AS start_date, max(created_at)::DATE::DATEPICKER_TO AS end_date,FROM sessions;We use DATEPICKER_FROM and DATEPICKER_TO to define the variables start_date and end_date,
and set the default values to the min and max date in the dataset.
The variables can be used in later queries using DuckDB’s getvariable() function.
Note that variables are always strings or arrays of strings.
Right after we define another variable as a multi-select dropdown menu that we use to filter other data later on:
SELECT 'Category'::LABEL;SELECT category::DROPDOWN_MULTI AS categoryFROM sessionsGROUP BY categoryORDER BY category;We use an additional, optional SELECT statement to define a label for the select button.
The same pattern can be used to set labels for any UI component.
After defining our filters, we create a temporary table that filters the data based on the selected variables:
CREATE TEMP TABLE dataset AS ( SELECT * FROM sessions WHERE category IN getvariable('category') AND created_at BETWEEN getvariable('start_date') AND getvariable('end_date') );This helps to avoid repeating the same filtering logic for every query.
Downloading Data
Section titled “Downloading Data”One of the most crucial features of any data dashboard is the ability to download data
and do further analysis with your favorite tool.
We can render download buttons using ::DOWNLOAD_CSV or ::DOWNLOAD_XLSX:
SELECT ('sessions-' || today())::DOWNLOAD_CSV AS "CSV";SELECT * FROM dataset;The value 'sessions-' || today() is used as file name and the column name AS "CSV" is used as button label.
The second SELECT statement is not rendered as a UI component, but is used to fetch the data for the download.
Displaying Data
Section titled “Displaying Data”The next two queries render data as is. Shaper can display queries that only return a single value:
SELECT count(*) AS "Total Sessions" FROM dataset;And if queries return multiple values, they are rendered as tables if no further formatting is specified:
SELECT 'Summary'::LABEL;SELECT category AS "Category", count(*) AS "Sessions", to_seconds(round(avg(duration))) AS "Avg Duration",FROM dataset GROUP BY "Category" ORDER BY "Sessions" DESC;Bar and Line Charts
Section titled “Bar and Line Charts”To render charts, we define one column as chart axis using XAXIS or YAXIS,
and then we define another column as chart value using ::BARCHART, ::BARCHART_STACKED, ::LINECHART, etc.
SELECT 'Sessions By Time of Day'::LABEL;SELECT date_trunc('hour', created_at)::TIME::XAXIS AS "Time of Day", count()::BARCHART AS "Total Sessions",FROM dataset GROUP BY ALL ORDER BY ALL;The above query uses trailing commas on all selected columns, it skips the * in count() and it uses GROUP BY ALL and ORDER BY ALL.
These are all DuckDB-specific SQL features that make working with SQL more convenient.
You can read more about them in the DuckDB’s Friendly SQL documentation.
The column names defined via AS ... are used as labels in the chart.
Omit them to render a chart without labels.
SELECT 'Sessions per Week'::LABEL;SELECT date_trunc('week', created_at)::XAXIS, category::CATEGORY, count()::BARCHART_STACKED,FROM dataset GROUP BY ALL ORDER BY ALL;Charts can define an additional CATEGORY column to render multiple series in the same chart.
Dashboard Layout
Section titled “Dashboard Layout”Shaper tries to automatically layout dashboards based on the screen size and the number of queries, but there are additional options to control the layout.
In the example dashboard we are using SECTION twice:
First, we use it to display a title on the top of the page:
SELECT 'Shaper Sessions Demo Dashboard'::SECTION;Second, we use it break the flow so that queries show up in a new row:
SELECT ''::SECTION;Checkout the rest of the documentation to learn about all available features and details on how to use them.
If you are looking for managed hosting, support plans or other professional services, see our plans and pricing page.
And don’t hesitate to reach out if you have any questions or feedback.